

First-serve points won, return points won, and last-52-weeks surface splits are the three WTA stats that separate sharp fantasy picks from guesswork. Before any draft or live swap, those three numbers tell you more than a player's current ranking ever will. The WTA stats every gamer should know go well beyond the scoreboard — they live in serve metrics, return rates, derived pressure stats, and surface-specific splits that most casual fans never check.
Here is the priority checklist, ranked by fantasy impact:
- First-serve points won % — directly drives scoring upside on serve-heavy players
- Return points won % — the single best predictor of a player's ability to create break opportunities
- Last-52-weeks surface split — filters out irrelevant results from the wrong surface
- Break points converted % — measures whether a player cashes in on chances
- Deciding Set Win % — flags high-risk picks in knockout tournament formats
- Dominance Ratio (DR) — one number that combines serve and return dominance
- Double fault rate — negative variance that tanks fantasy scores fast
- Strength of Schedule (SoS) — context for whether a win percentage is real or padded
- Elo rating — a more stable long-run form signal than ATP/WTA ranking points
- Recent form (last 5–10 matches) — short-term momentum, especially post-injury
Stat to know: Deciding Set Win % is the pressure metric most gamers overlook. A player who wins 70% of their deciding sets is a far safer tournament pick than one sitting at 45%, even if their overall win rate looks identical.
Key Takeaways
The single most important shift any fantasy tennis gamer can make is moving from ranking-based picks to stat-based picks — specifically first-serve points won, return points won, and surface-specific splits filtered to the last 52 weeks.
| Point | Details |
|---|---|
| Prioritize serve and return rates | First-serve points won % and return points won % are the two highest-impact stats for fantasy scoring. |
| Always filter by surface and timeframe | Last-52-weeks surface splits are more predictive than career or calendar-year averages. |
| Check sample size before trusting any stat | Fewer than 15 matches on a surface makes any split unreliable for lineup decisions. |
| Use Deciding Set Win % for pressure picks | Players below 50% in deciding sets are high-risk in knockout tournament formats. |
| Tweener applies this workflow in live contests | Tweener's private leagues and live scoring let you act on these stats during real Grand Slam matches. |
Table of Contents
- 1. Serving stats you need to check before every draft
- 2. Return stats that flip player value in fantasy matchups
- 3. Surface splits and the rolling 52-week window: read both together
- 4. Derived metrics every gamer should know
- 5. Head-to-head and recent form: how many matches to trust
- 6. Where to find WTA stats and how to read the tables
- 7. How to build winning fantasy tennis lineups with WTA stats
- Stats win, hunches lose — and the data proves it
- Tweener puts these stats to work in live fantasy contests
- Sources
1. Serving stats you need to check before every draft
Serving stats are the fastest way to project fantasy ceiling. A player who aces frequently and holds serve at a high rate generates consistent points across every match, while a double-fault-prone server introduces variance that can wreck a lineup in a single bad game.
The four metrics that matter most:
- Aces per match — raw upside signal; high ace counts correlate with dominant service games and fewer break points faced
- Double faults per match — the flip side; even one double fault per service game compounds into real negative scoring
- First-serve percentage — how often a player lands their first serve in; below 55% usually means they are playing too many second-serve points
- First-serve points won % — the most predictive of the four; a player winning 75%+ of first-serve points is nearly unbreakable on serve
The priority rule is simple: favor consistent servers over big servers when the draw is tough. A player with a 68% first-serve points won rate and a 62% first-serve percentage is more reliable than one who aces 12 times but double-faults 6. The latter is a coin flip. The former is a floor.
One common misread is ignoring opponent return strength when evaluating serve stats. A 70% first-serve points won rate against weak returners looks very different against a player like Aryna Sabalenka or Iga Świątek, who both rank among the tour's best at neutralizing big serves. Always cross-reference serve metrics against the opponent's return points won percentage before locking a serve-heavy pick.
Pro Tip: Filter serve stats by surface before comparing players. First-serve points won on grass runs 3–5 percentage points higher than on clay for most players — comparing a grass specialist's serve numbers to a clay specialist's without that filter will mislead you every time.
2. Return stats that flip player value in fantasy matchups
Return metrics are where fantasy edges hide. Most casual gamers focus on serve stats because they are easier to read, but return numbers tell you which player is going to create break opportunities and win ugly matches.
Three numbers to pull every time:
- Return points won % — the percentage of all return points a player wins; anything above 40% on hard courts is genuinely strong
- Break points converted % — how efficiently a player converts break chances; a high rate here means fewer wasted opportunities and more set wins
- Break points saved % — the defensive mirror; a player saving 65%+ of break points faced is hard to break down even when serving poorly
Return Rating is a composite metric some aggregators publish that combines these into a single score. It is useful for quick comparisons, but always check the underlying numbers when the rating looks surprising.
The matchup edge comes from layering return stats against the opponent's serve. If Player A wins 42% of return points and Player B serves only 58% of first serves in, Player A is going to create multiple break opportunities per set. That translates directly to fantasy scoring through set wins and match wins.
On small samples: A player who has played fewer than 15 matches on a given surface in the last 52 weeks can show a return points won rate that swings wildly. A 44% return rate across 8 matches is not the same signal as 44% across 40 matches. Always check the sample match count before trusting a return figure.
Pro Tip: When a high-ace server faces a player with a top-10 return points won rate, the expected fantasy outcome shifts toward a longer match with more breaks. That means more total games played — which can actually boost fantasy scoring for both players if your platform rewards game-level stats.
3. Surface splits and the rolling 52-week window: read both together
Surface and timeframe are the two context layers that make every other stat meaningful. A player's career clay numbers mean almost nothing if she has not played clay in 14 months. The rolling 52-week window solves part of that problem, but you still need to layer surface splits on top.
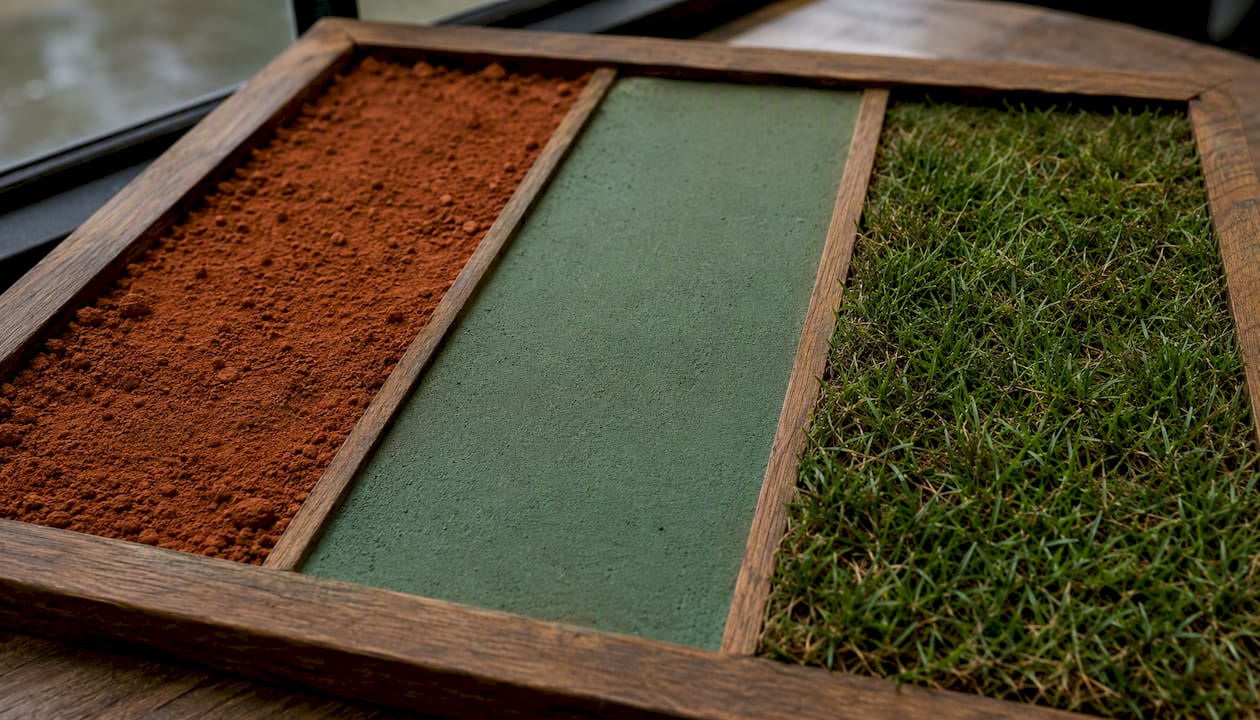
WTA rankings operate on a rolling 52-week cumulative points system, which means ranking positions shift as old results drop off. A player defending a deep run from last year's French Open will lose those points the moment that tournament week passes — even if she has been playing well. That creates real ranking volatility and, for gamers, real opportunity.
The WTA's official stats site presents player stats as calendar-year cumulative figures, not rolling 52-week splits. That distinction matters. Calendar-year stats in January look very different from the same player's rolling 52-week picture, which includes late-season results from the prior year. For fantasy purposes, the rolling window is almost always more useful.
Tennis Abstract's match-level splits let you filter by surface and timeframe simultaneously, which is the combination you actually need. Pull a player's hard-court return points won rate for the last 52 weeks, not her career clay average, before a hard-court tournament.
Minimum-match thresholds by surface:
| Surface | Minimum matches for reliable splits |
|---|---|
| Hard court | 10 matches |
| Clay | 15+ matches |
| Grass | 10+ matches (shorter season) |
Grass gets a lower threshold because the season is short and even 10 matches represents a meaningful sample for most players.
Pro Tip: A surface spike — say, a player suddenly posting a 48% return rate on clay after averaging 38% — is worth investigating before trusting. Check whether it came against weak opponents or in a single tournament. Two or three tournaments of sustained performance is a real signal; one hot week is noise.
4. Derived metrics every gamer should know
Raw stats tell you what happened. Derived metrics tell you what it means.
Dominance Ratio (DR) is the most useful composite stat in tennis analytics. The formula: service points won % divided by return points lost % (which equals 100 minus return points won %). A DR above 2.0 indicates a dominant player; below 1.5 suggests a player who is competitive but not controlling matches. TennisDB's glossary covers the underlying metrics that feed into DR and similar composite scores.
Strength of Schedule (SoS) is the context stat that raw win percentages lack. A player with a 78% win rate who has played mostly lower-ranked opponents is a weaker pick than one with a 68% win rate against top-50 competition. SoS percentile ranks how difficult a player's schedule has been — a high SoS paired with a solid win rate is a genuine signal of quality. Tournament schedules affect SoS directly, so checking draw difficulty before a tournament is part of the same workflow.
Other derived metrics worth tracking:
- Deciding Set Win % — the pressure stat; players below 50% in deciding sets are high-risk picks in knockout formats
- Tiebreak Win % — a narrower clutch indicator; useful when two players are otherwise close in overall metrics
- Deep Run % — how often a player reaches the quarterfinal or later; a consistency measure that raw match wins do not capture
Warning: Derived metrics are sensitive to sample size. A DR calculated from 8 matches is almost meaningless. Treat any composite stat from fewer than 15 matches as directional at best, and weight it accordingly against larger-sample raw stats.
5. Head-to-head and recent form: how many matches to trust
H2H records feel decisive. They rarely are, at least not on their own.
The practical rule: weight H2H only when the matches were played on the same surface within the last three years, and when the sample is at least four meetings. A 3-0 H2H that includes two clay matches and one grass match from 2019 tells you almost nothing about a hard-court encounter in 2026. Surface and era context strip most H2H records of their apparent significance.
For recent form, three windows serve different purposes:
- Last 5 matches — momentum and current fitness; most useful for in-play decisions and late-week swaps
- Last 10 matches — short-term form trend; good for pre-tournament picks when a player is on a run
- Last 52 weeks — the baseline; use this as the primary form signal and treat shorter windows as adjustments on top of it
Fatigue is the variable most gamers underweight. A player who has gone deep in three consecutive tournaments — say, semifinals, final, quarterfinal — has accumulated significant match minutes. On hard courts especially, that load shows up as slower movement and more unforced errors by the third set. Check match lengths, not just results. A player who won her last five matches in straight sets is in a very different physical state than one who won five three-setters.
Scheduling red flag: Watch for players traveling across time zones between tournaments with fewer than five days of recovery. The WTA schedule can compress dramatically during the swing from North American hard courts to European clay. A player who played a final in Miami on Sunday and opens in Madrid the following Wednesday is a downgrade candidate regardless of her ranking.
Pro Tip: When two players look nearly identical on paper, check their last-10-match deciding set records. The one closing tight matches at a higher rate is the safer pick in a tournament format where every round is elimination.
6. Where to find WTA stats and how to read the tables
Four sources cover most of what you need, and each does something different.
- WTA official stats site — the starting point for calendar-year cumulative figures; best for current-season serve and return leaders, but limited on surface splits and historical depth
- Stats Perform — the official WTA data partner; delivers shot-by-shot feeds and AI-powered pattern analysis that goes well beyond win-loss totals; the source behind most broadcast and app-level live data
- TennisDB — the best aggregator for season pages, Elo ratings, ranking snapshots, and downloadable tables; the TennisDB glossary is the fastest way to look up any metric definition
- Tennis Abstract — the analyst's tool; match-level splits, surface filters, and form scores in one interface; supports CSV export for building your own comparisons
How to read a stats table without getting misled:
- Always check the "Matches" or "Sample" column first. A player ranked first in return points won with 6 matches played is not a reliable pick.
- Apply the surface toggle before reading any split. Default views often show all-surface aggregates, which blend incompatible data.
- Use the minimum-match filter. Most aggregators let you set a floor (e.g., 15+ matches). Set it before comparing players.
- Export to CSV when comparing more than four players. Sorting in a spreadsheet is faster and less error-prone than toggling between profile pages.
| Column to check | What it tells you | Filter to apply |
|---|---|---|
| 1st Serve % | Serve consistency | Surface + last 52 weeks |
| Return Pts Won % | Return dominance | Surface + min. 15 matches |
| Break Pts Converted | Clutch efficiency | Surface + last 52 weeks |
| Deciding Set W% | Pressure performance | All surfaces, last 52 weeks |
| Sample / Matches | Data reliability | Set minimum before reading |
Understanding how sports statistics are collected helps you spot when a feed has a lag or when a stat is being measured differently across sources. Official feeds from Stats Perform update in near real time; third-party aggregators may lag by hours or days during live tournaments.
7. How to build winning fantasy tennis lineups with WTA stats
The workflow that converts raw stats into winning Tweener lineups runs in five steps.
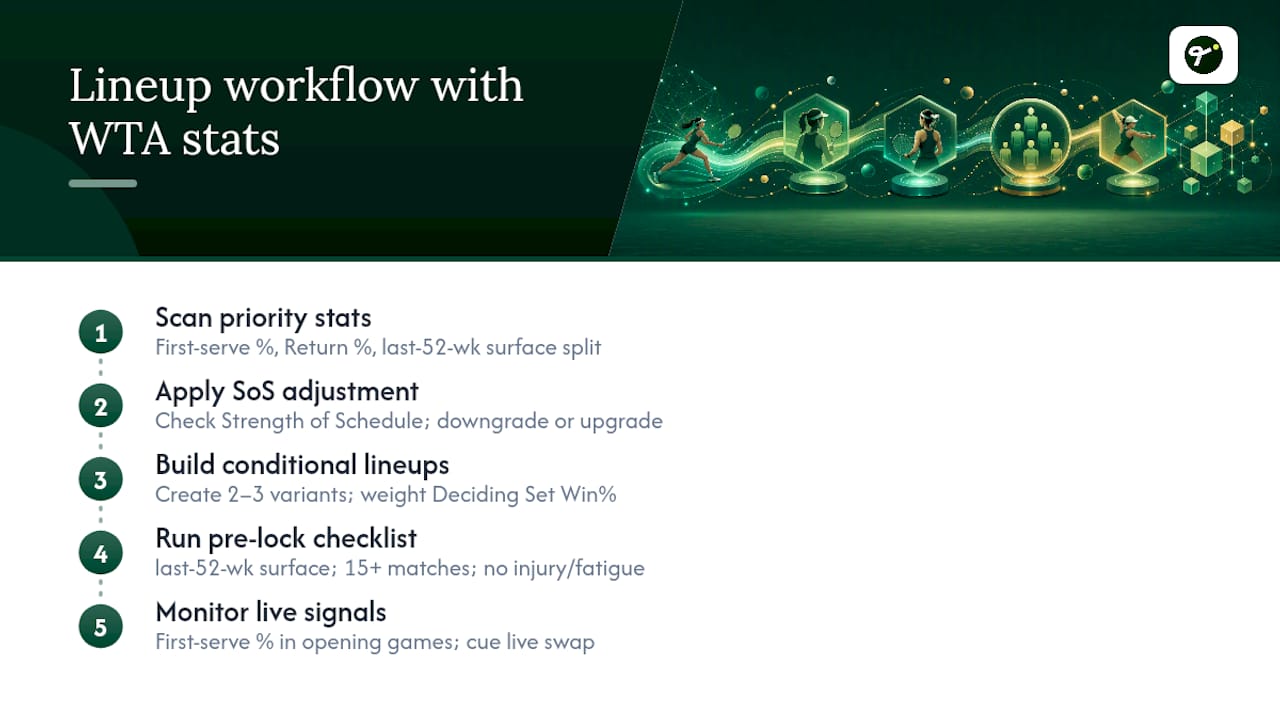
Step 1: Scan priority stats. Pull first-serve points won %, return points won %, and last-52-weeks surface split for every player in your consideration set. Eliminate anyone below your surface-specific thresholds before going further.
Step 2: Apply SoS adjustment. Check each remaining player's Strength of Schedule. Downgrade players whose strong win rates came against weak draws. Upgrade players who have been performing well against top competition.
Step 3: Build conditional lineups. Create two or three lineup variants based on different match outcome scenarios. If a high-DR player faces a weak returner, build one lineup around her dominance. If the match looks like a grind, weight your lineup toward the player with the better Deciding Set Win %.
Step 4: Run the pre-lock checklist. Before the lineup locks, confirm: surface split is current (last 52 weeks), sample size is adequate (15+ matches), no injury news in the last 48 hours, and no scheduling fatigue flag.
Step 5: Monitor live signals. First-serve percentage in the opening games is the fastest live indicator. That is your cue to consider a live swap if your platform allows it.
Tweener's private league format — up to 9 friends per Grand Slam — is where this workflow pays off most. When everyone in the league is watching the same match, the gamer who checked Deciding Set Win % and SoS before the draft has a structural edge over the one who picked on ranking alone. Tennis analytics are the difference between reacting to results and anticipating them.
Pro Tip: Combine surface split and form score to find underpriced picks. A player with a strong clay return rate who has been underperforming on hard courts will often be undervalued heading into Roland Garros. Her hard-court results drag down her overall ranking, but her clay-specific numbers tell a different story.
Stats win, hunches lose — and the data proves it
The conventional wisdom in fantasy sports is that experience and gut feel matter as much as data. In tennis, that is harder to defend than in team sports. A tennis match is a closed system: two players, a surface, and a set of measurable interactions. Every serve, return, and break point is recorded. The signal is there if you look for it.
What most gamers underestimate is how much of the edge comes not from finding obscure stats, but from applying basic ones correctly. Return points won % is not a secret metric. But most players drafting for a Grand Slam never check it against the opponent's serve stats, never filter it by surface, and never verify the sample size. That gap between knowing a stat exists and actually using it correctly is where fantasy tournaments are won.
The other thing worth saying plainly: predicting tennis outcomes is a skill that compounds. The gamer who runs this checklist for a full Grand Slam develops pattern recognition that makes the next tournament faster and sharper. Stats are the starting point, not the finish line.
Tweener puts these stats to work in live fantasy contests
Tweener is the fantasy tennis app built for exactly this kind of analytical approach. While most fantasy platforms treat tennis as an afterthought, Tweener is purpose-built around WTA and ATP match data — live scoring, surface filters, and private leagues that let you compete with up to 9 friends through every round of a Grand Slam.
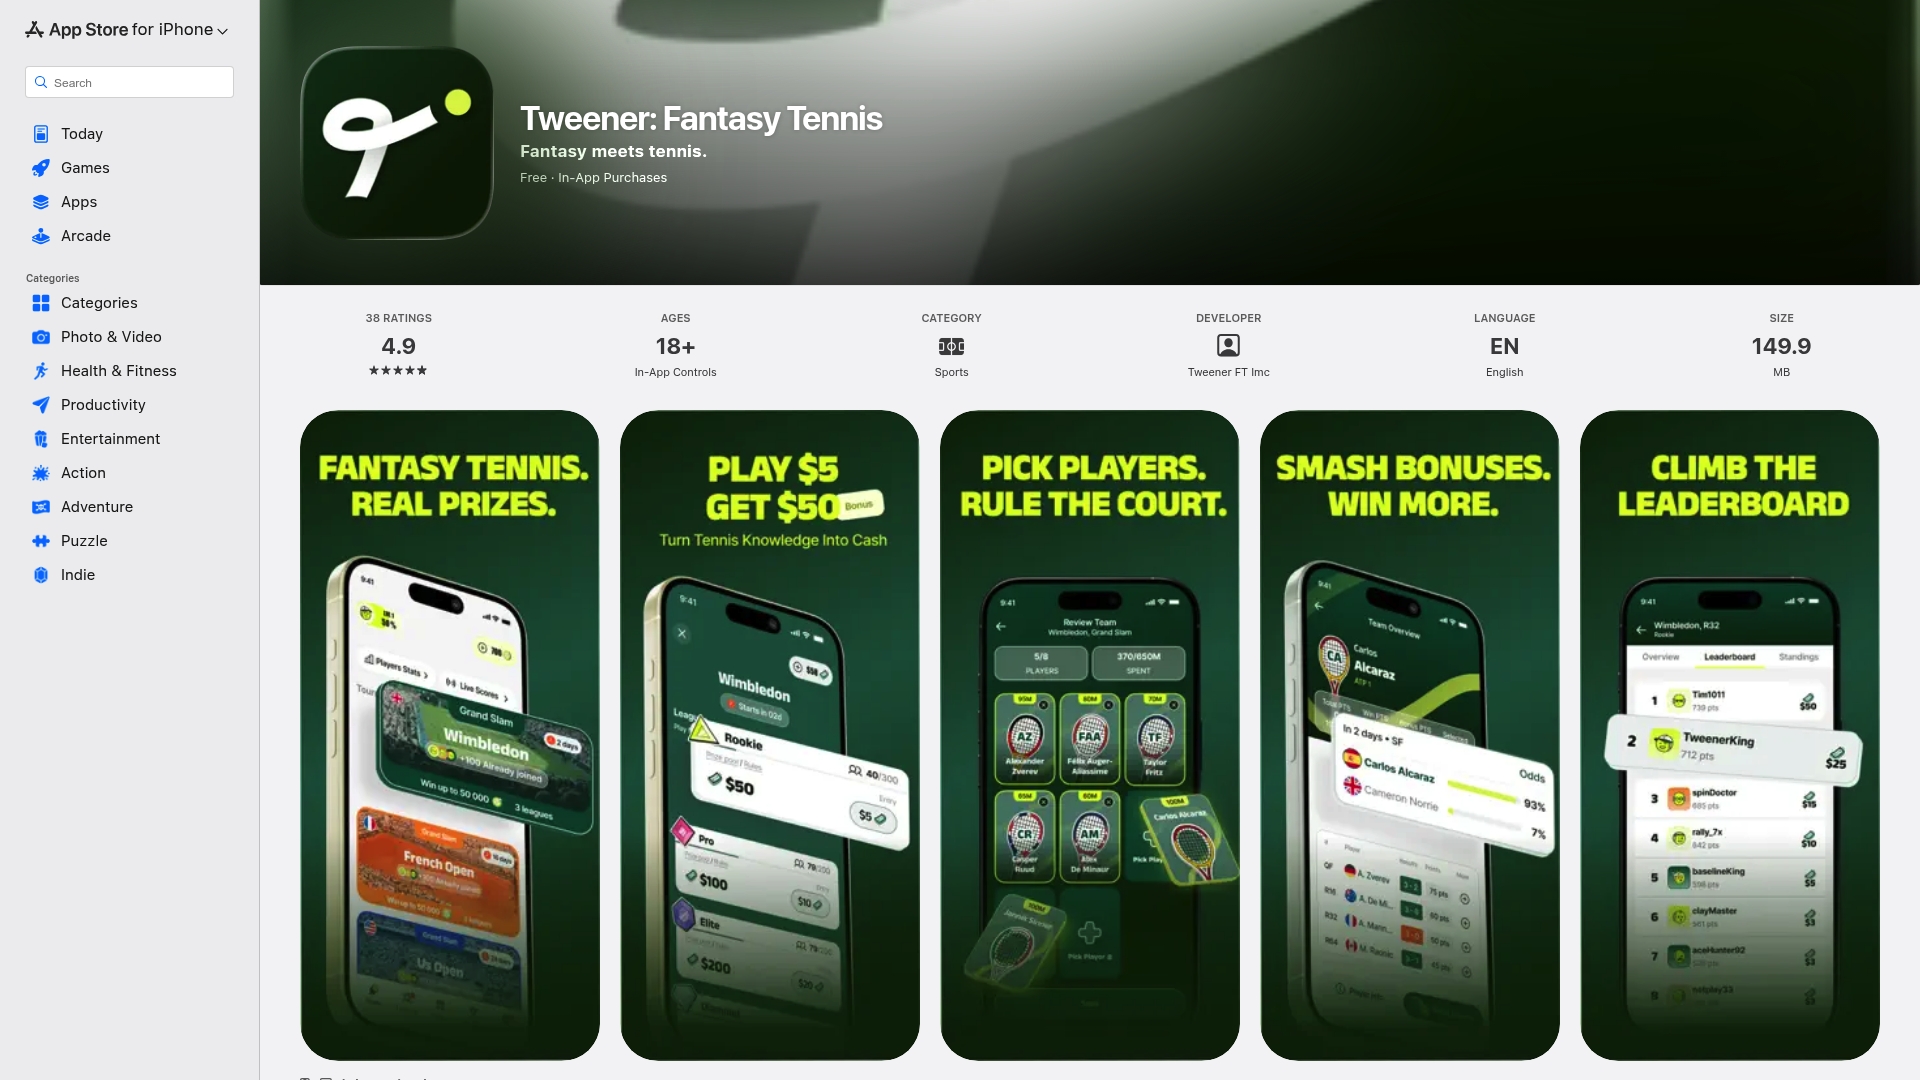
The checklist in this article maps directly to how Tweener's draft and pick'em modes work. You can filter player selections by recent form, check surface context before locking a lineup, and track live match stats as they update. For paid contests, Tweener offers real-money competition where legally permitted — and responsible play resources from BeGambleAware are always available if you need them.
If you want to put the Deciding Set Win % filter to work in a real contest, download Tweener and set up a private Grand Slam league before the next major. The edge is in the data. The game is where you use it.
Sources
A short list of the resources worth bookmarking before your next draft:
- Tennis Stats | Latest Player & Match Statistics - WTA Tennis
- Tennis Abstract: WTA Match Results, Splits, and Analysis
- Begambleaware
On source reliability: official WTA data via Stats Perform is the most accurate for live and shot-level metrics. TennisDB and Tennis Abstract are strong for historical splits and derived metrics, but may lag by a day or two during live tournaments. When a stat from two sources disagrees, prefer the one with the larger stated sample size and the more recent update timestamp.