
Machine learning models can predict match outcomes mid-game with over 90% accuracy, transforming how players, coaches, and fantasy sports enthusiasts approach tennis. While traditional stats like aces and double faults tell part of the story, modern analytics reveals tactical patterns, psychological momentum, and betting inefficiencies invisible to the naked eye. This article explores how tennis analytics enhances your understanding of the game, sharpens fantasy sports strategies, and uncovers profitable betting opportunities that intuition alone cannot capture.
Table of Contents
- Understanding Tennis Analytics And Its Predictive Power
- How Analytics Reveals Player Performance And Tactical Insights
- Using Tennis Analytics To Improve Betting And Fantasy Sports Outcomes
- Common Misconceptions And The Nuanced Reality Of Tennis Analytics
- Enhance Your Tennis Experience With Tweener
- Why Follow Tennis Analytics: Frequently Asked Questions
Key takeaways
| Point | Details |
|---|---|
| Predictive accuracy | Machine learning models achieve 70-90% accuracy using real-time match data and momentum metrics. |
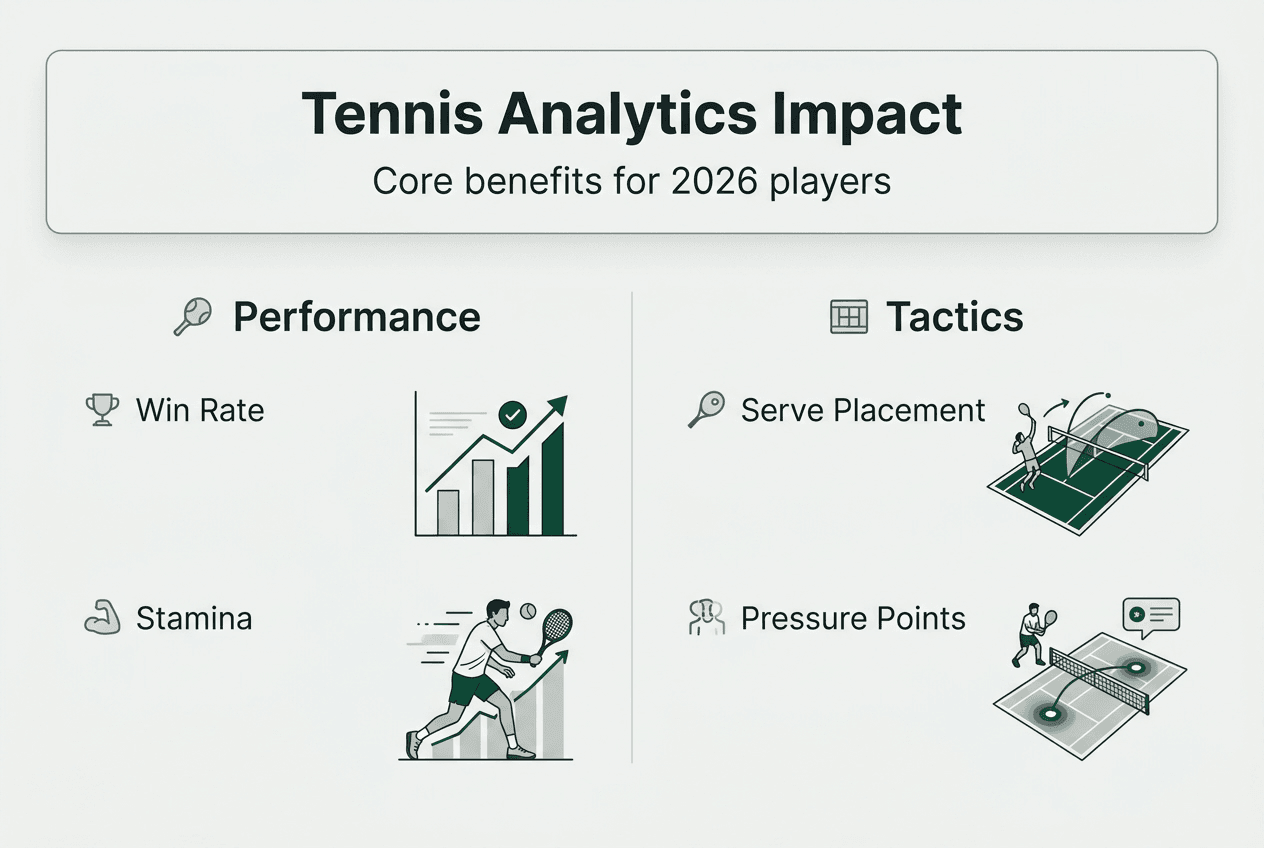
| Tactical insights | Analytics reveals serve placement patterns, shot selection tendencies, and opponent weaknesses beyond traditional statistics. |
| Betting advantages | Understanding market biases like favorite-longshot effects improves ROI by identifying value bets others miss. |
| Fantasy optimization | Data-driven player selection based on surface performance and recent form outperforms gut instinct picks. |
| Contextual understanding | Proper analytics interpretation requires surface context, player motivation, and psychological factors, not just raw numbers. |
Understanding tennis analytics and its predictive power
Tennis analytics combines machine learning algorithms, real-time data collection, and statistical modeling to predict match outcomes and reveal player tendencies. Unlike traditional box scores that only show final serve percentages or winner counts, modern analytics tracks every point's context: score situation, momentum shifts, and psychological pressure. These systems process thousands of data points per match, identifying patterns that determine whether a player will hold serve at 30-30 or convert a break point opportunity.
Predictive models demonstrate remarkable accuracy when fed sufficient in-game data. Early match predictions using just the first set achieve 70% accuracy, while mid-match models incorporating momentum metrics reach over 90% precision. Researchers quantify psychological momentum through entropy calculations, measuring how point-by-point outcomes deviate from expected patterns. When a player wins consecutive points against the odds, entropy increases, signaling a momentum shift that traditional stats cannot capture.
Different analytical approaches yield varying results. Soft voting classifiers that combine multiple algorithms outperform single-method predictions, achieving the highest accuracy rates. Random forest models excel at identifying non-linear relationships between serve speed and point outcomes. Neural networks detect subtle tactical adjustments players make when facing break points versus game points.
Key data inputs driving these predictions include:
- First serve percentage and placement patterns by court position
- Return of serve efficiency split by deuce versus ad court
- Point outcome sequences measuring momentum and psychological state
- Rally length distributions indicating player fatigue or tactical shifts
- Break point conversion rates under different score pressures
Pro Tip: Track serve direction patterns during live matches using a simple tally system. Note whether players favor body serves, wide serves, or down-the-T placements at critical points. This basic tracking mirrors what professional models do and helps you anticipate tactical changes before they happen.
The live tennis prediction accuracy guide demonstrates how these models work in practice, showing which data points matter most at different match stages. Understanding this predictive foundation transforms how you watch matches, moving from passive observation to active pattern recognition that informs smarter fantasy picks and betting decisions.
How analytics reveals player performance and tactical insights
Advanced metrics expose performance dimensions invisible in traditional statistics. The ATP releases advanced Tennis IQ platform tracking serve placement and shot selection patterns that reveal how players construct points and exploit weaknesses. Serve placement analytics show whether a player targets the body on second serves when ahead versus behind in games. Return efficiency metrics split by serve speed bands identify which players struggle against 120+ mph serves but dominate slower offerings.

Tactical analysis through analytics reveals pressure responses that determine match outcomes. Ivan Lendl famously studied John McEnroe's serve patterns at break points, discovering McEnroe favored wide serves on the ad court when nervous. This insight, derived from meticulous data collection before modern technology existed, exemplifies how analytics uncovers exploitable tendencies. Today's systems automate this process, tracking thousands of situational patterns across entire careers.
Wearable technology adds physiological data to tactical insights. Heart rate variability during changeovers indicates fatigue levels that predict performance drops in later sets. Accelerometer data measures movement efficiency, showing when players begin favoring one side due to minor injuries. GPS tracking reveals court coverage patterns, identifying whether a player protects their backhand by positioning further left than optimal.
Video and scouting tools identify opponent patterns and tactical adjustments mid-match. Coaches use video analysis tools to tag every forehand approach shot, cataloging success rates by court position and opponent stance. This granular analysis informs pre-match game plans and in-match tactical pivots. When a player's drop shot success rate plummets from 60% to 30% after the first set, analytics reveals whether opponents adjusted positioning or the player's execution deteriorated.
Key player performance metrics gathered through analytics:
- Serve placement heat maps showing target zones by score situation
- Rally aggression indices measuring when players attack versus defend
- Court positioning tendencies revealing movement patterns and coverage gaps
- Shot selection matrices tracking which shots follow specific ball placements
- Pressure point conversion rates isolating performance under stress
Pro Tip: Study how top players adjust tactics between sets by comparing first-set versus second-set serve placement patterns. Players often shift strategies after opponents adapt, and recognizing these adjustments helps you predict momentum swings before they reflect in the score.
Understanding tennis game rules and tactics provides context for interpreting these metrics. Analytics quantifies tactical choices, but strategic understanding explains why certain patterns emerge. A player serving 80% first serves might seem conservative, but analytics reveals this approach maximizes hold percentage against aggressive returners by reducing double fault risk at critical moments.
Using tennis analytics to improve betting and fantasy sports outcomes
Data-driven approaches expose market inefficiencies that casual bettors miss. The favorite-longshot bias affects tennis betting yields, creating systematic mispricings where favorites offer better value than odds suggest. Bookmakers shade lines toward longshots because recreational bettors overvalue upset potential, leaving smart money opportunities on heavily favored players. Analytics quantifies this bias, showing that betting favorites in early Grand Slam rounds generates higher long-term returns than chasing underdogs.
Betting strategy comparison reveals the profit gap between approaches:
| Strategy | Average ROI | Bet Volume | Risk Level |
|---|---|---|---|
| Favorite betting (analytics-based) | 14.8% | High consistency | Lower variance |
| Underdog chasing (intuition) | 7.0% | Sporadic wins | High variance |
| Market-neutral hedging | 4.2% | Requires multiple books | Minimal risk |
| Live betting with momentum data | 11.3% | Selective opportunities | Medium variance |
A data-driven approach doubled ROI from 7% to 14.8% by focusing on early tournament rounds where information asymmetry favors informed bettors. Casual money floods later rounds, tightening lines and reducing edge. Analytics identifies which early matches feature mispriced favorites based on surface-specific performance metrics bookmakers underweight.
Court speed and surface variations dramatically impact predictions and value identification. Hard court data from Australian Open rarely predicts clay court Roland Garros performance accurately. Players with heavy topspin forehands dominate slower clay but struggle on fast grass where flat hitting prevails. Analytics models surface-specific hold percentages, revealing that a player's 85% service hold rate on hard courts might drop to 72% on clay, information bookmakers sometimes lag in incorporating.
Best practices for data-driven betting and fantasy tennis:
- Concentrate bets in early tournament rounds where recreational money creates inefficiencies and analytics provides maximum edge over the market.
- Build odds models using surface-specific data rather than overall career statistics to capture performance variations bookmakers often miss.
- Exploit WTA market inefficiencies where lower betting volumes create wider spreads and slower line adjustments to new information.
- Factor player motivation and tournament preparation into models, as analytics alone misses intangibles like players tanking matches before preferred events.
- Track projected hold percentages by surface and opponent quality to identify value bets where bookmaker odds underestimate favorite win probability.
Modeling projected hold percentages informs value betting by comparing your calculated win probability against implied odds. When your model shows a favorite has 75% win probability but odds imply only 68%, the gap represents positive expected value worth exploiting. This approach requires accurate surface-specific data and proper accounting for head-to-head dynamics, but consistently identifies profitable opportunities.
Pro Tip: Combine analytics with sharp betting discipline by setting strict bankroll limits and only betting when your model shows 5%+ edge over market odds. This selectivity maximizes long-term ROI while avoiding the trap of forcing bets on marginal edges that variance can easily erase.
The fantasy tennis picks for 2026 demonstrate how these analytical principles apply to fantasy sports, where identifying undervalued players based on surface performance and recent form provides competitive advantages over opponents relying on name recognition alone.
Common misconceptions and the nuanced reality of tennis analytics
Narrow head-to-head leads mislead when context disappears. Lazy journalism overemphasizes narrow head-to-head leads without considering surface and recent form, creating false narratives about player matchups. A 3-2 career record means little when all three wins occurred on clay but the upcoming match happens on grass. Analytics reveals that surface-specific head-to-heads predict outcomes far better than overall records, yet media and casual fans fixate on aggregate numbers.
The unforced error statistic faces fundamental validity challenges. The concept of unforced errors is debated because isolating player fault from opponent pressure proves nearly impossible. What one scorer calls an unforced error, another attributes to opponent positioning that forced a difficult shot. A player hitting into the net on a seemingly easy ball might be responding to subtle court positioning or shot pace that created time pressure. This subjectivity makes unforced error counts unreliable for comparing players or predicting future performance.
Common analytics misconceptions that lead to poor decisions:
- Treating all aces equally without considering serve speed, placement, or score situation context that determines tactical value versus lucky outcomes
- Ignoring recency bias by weighting five-year career stats equally with last three months when recent form predicts immediate performance better
- Misunderstanding psychological momentum as random variance rather than quantifiable entropy shifts that predictive models successfully incorporate
- Overvaluing break point conversion percentages without accounting for opponent quality, as converting against weak servers means less than struggling against elite servers
- Assuming linear relationships between stats and wins when tennis outcomes follow complex non-linear patterns requiring machine learning to model accurately
Expert analysts caution against simplistic stat interpretations, emphasizing that context transforms numbers from misleading to meaningful. Surface type, opponent strength, tournament importance, and player motivation create layers of nuance that raw statistics cannot capture without proper analytical frameworks.
Realistic understanding improves practical application whether coaching, playing, or managing fantasy teams. A coach reviewing serve stats must separate first serve percentage on clay versus grass to develop surface-specific tactics. Fantasy managers need recent form weighted heavily because a player's ranking reflects career achievements but recent results predict immediate tournament performance. Betting strategies require surface-adjusted models because bookmakers often use simplified algorithms that sharp bettors can exploit.
Pro Tip: Always combine at least three independent data points before drawing conclusions. If analyzing a potential fantasy pick, check surface-specific performance, recent tournament results, and head-to-head records on the relevant surface. This triangulation prevents misleading conclusions from any single metric's limitations.
Understanding fantasy team management in tennis requires this nuanced approach, balancing statistical insights with contextual factors that pure numbers miss. The best fantasy managers and bettors use analytics as a foundation but layer in qualitative assessments that complete the picture.
Enhance your tennis experience with Tweener
Applying tennis analytics becomes practical and accessible through dedicated platforms designed for fans and fantasy players. Tweener transforms raw data into actionable insights, helping you make smarter decisions whether competing in fantasy leagues or simply deepening your appreciation of professional tennis. The platform integrates real-time match data with advanced player statistics, presenting complex analytics through an intuitive interface that requires no statistical background.
Key features that bring analytics to your fingertips:
- Live match data feeds showing momentum shifts and tactical patterns as they develop during tournaments
- Surface-specific player performance metrics revealing who excels on clay, grass, or hard courts
- Head-to-head analytics with proper context including surface splits and recent form weighting
- Fantasy team optimization tools suggesting lineup changes based on tournament draws and player matchups
- Betting-relevant insights highlighting value opportunities and market inefficiencies
Pro Tip: Use Tweener's analytics-based tools to identify undervalued players before tournaments begin. Early lineup locks at favorable pricing provide advantages over waiting until late when popular picks become overpriced and limit your team-building flexibility.
The Tweener fantasy tennis platform makes professional-grade analytics accessible to casual fans, bridging the gap between complex predictive models and practical fantasy sports application. Whether you compete for virtual coins or real money prizes, data-driven decision-making through Tweener game rules and strategies elevates your experience beyond guesswork and intuition.
Why follow tennis analytics: Frequently asked questions
What is tennis analytics and why does it matter?
Tennis analytics uses machine learning, statistical modeling, and real-time data collection to predict match outcomes and reveal tactical patterns invisible in traditional statistics. It matters because these insights improve fantasy sports performance, identify betting value, and deepen appreciation of strategic nuances that determine match results. Players and coaches use analytics to exploit opponent weaknesses and optimize game plans.
How accurate are tennis analytics in predicting match outcomes?
Machine learning models achieve 70% accuracy using early match data from just the first set, improving to over 90% accuracy mid-match when incorporating momentum metrics and point-by-point patterns. Accuracy depends on data quality and model sophistication, with ensemble methods combining multiple algorithms outperforming single-approach predictions. Surface-specific models predict better than generic career-based statistics.
Can tennis analytics improve my fantasy tennis performance?
Yes, analytics significantly improves fantasy performance by identifying undervalued players based on surface-specific strengths, recent form, and favorable tournament draws that casual players overlook. Data-driven lineup construction outperforms name recognition picks because analytics reveals which players match up well against likely opponents and perform best on specific surfaces. Understanding projected hold percentages and break point conversion rates helps predict tournament advancement better than rankings alone.
Is it difficult to understand advanced tennis statistics?
Modern platforms present complex analytics through user-friendly interfaces requiring no statistical background, making advanced metrics accessible to casual fans. While underlying models use sophisticated machine learning, practical application focuses on actionable insights like serve placement patterns and momentum indicators. Start with basic metrics like surface-specific win rates before progressing to entropy calculations and predictive modeling.
How do professional players and coaches use analytics?
Professional teams employ dedicated analysts who study opponent tendencies, identify tactical weaknesses, and optimize training focus based on data-driven insights. Coaches use video analysis tools tagged with performance metrics to develop match-specific game plans and make real-time tactical adjustments. Players review serve placement heat maps and rally patterns to understand their own tendencies and exploit opponent vulnerabilities discovered through systematic data collection.