

TL;DR:
- Tracking fantasy league performance involves analyzing key metrics like Points For and Point Differential to assess true team strength. Using spreadsheets, advanced tools, and consistent weekly data collection improves decision-making and prevents overreaction to short-term results. Most players focus on win-loss records, but core metrics and proper tracking reveal deeper insights into skill and luck.
Tracking fantasy league performance is the process of measuring and analyzing your team's key metrics, decisions, and outcomes to build a real competitive edge over your opponents. Most players stop at their win-loss record. That is a mistake. Metrics like Points For (PF), Point Differential (DIFF), and start/sit efficiency reveal far more about your actual skill than the standings column ever will. For players in cash contests, the stakes go higher: the 1099-MISC filing threshold for net fantasy profits increased to $2,000 starting in tax year 2026, but all winnings remain taxable regardless of whether a form is issued.
How to track fantasy league performance: the metrics that matter
The single most important number in your league is Points For. PF reflects team skill and decision-making across the full season, which is why major platforms use it as the primary tiebreaker in playoff seeding. A player who scores consistently high PF but holds a losing record is almost certainly a victim of schedule luck, not poor management.

Points Against (PA) tells a different story. PA measures how many points your opponents scored against you each week. It is largely outside your control, since you cannot choose who you face. A high PA total often signals bad luck with scheduling rather than a weak roster.
Point Differential (DIFF) is PF minus PA summed across the season. DIFF gives a cleaner picture of true team quality than win-loss records alone. A player sitting at 5-7 with a positive DIFF is likely stronger than their record suggests.
Projection accuracy metrics add another layer. A Mean Absolute Error (MAE) below 5.0 points at skill positions signals competitive forecast quality. A correlation coefficient above 0.65 means your projections capture real signal. Below 0.45, the projections are essentially noise and should not drive lineup decisions.
| Metric | What it measures | Skill or luck? |
|---|---|---|
| Points For (PF) | Total points scored by your team | Skill |
| Points Against (PA) | Total points scored against you | Mostly luck |
| Point Differential (DIFF) | PF minus PA across the season | Skill |
| MAE | Average projection error per player | Projection quality |
| Start/sit efficiency | Points started vs. best possible lineup | Decision-making |
Pro Tip: Track your start/sit efficiency every week. Start/sit efficiency quantifies the points you left on the bench versus what you actually started. It is the clearest window into your lineup decision quality.
What tools work best for monitoring your league?
Spreadsheets are the starting point for most serious players. Google Sheets and Microsoft Excel handle PF, PA, and DIFF calculations with basic formulas. They require manual data entry, but they give you full control over how metrics are displayed and weighted.
Built-in league platform tools cover the basics. Most major platforms display weekly scores, standings, and transaction logs. The problem is that these dashboards rarely go beyond surface-level stats. They show you what happened. They do not help you understand why.
Data exporters fill that gap. Exporting league data to CSV enables advanced offline analysis, including draft value calculations and start/sit efficiency reports. Command-line tools that pull weekly box scores give you a dataset you can slice any way you want.
Dedicated analytics apps sit at the top of the stack. These platforms pull live data, calculate advanced metrics automatically, and often include visualization features. They cost more time to set up but pay off across a full season.
Key features to look for in any tracking solution:
- Data export: Can you pull raw scores and lineups as a CSV or spreadsheet?
- Metric calculations: Does it compute PF, PA, DIFF, and efficiency automatically?
- Visualization: Does it show trends over time, not just weekly snapshots?
- Sample size warnings: Does it flag metrics based on small samples as unreliable?
| Tool category | Best for | Limitation |
|---|---|---|
| Spreadsheets | Full control, custom metrics | Manual data entry |
| Platform dashboards | Quick weekly checks | Limited depth |
| CSV exporters | Advanced offline analysis | Requires technical setup |
| Analytics apps | Automated tracking, visuals | Setup time, possible cost |
Pro Tip: If you play in multiple leagues, a CSV exporter saves hours. Pull all your weekly box scores at once and run your efficiency calculations in a single spreadsheet rather than clicking through each platform manually.
Step-by-step setup for tracking your results
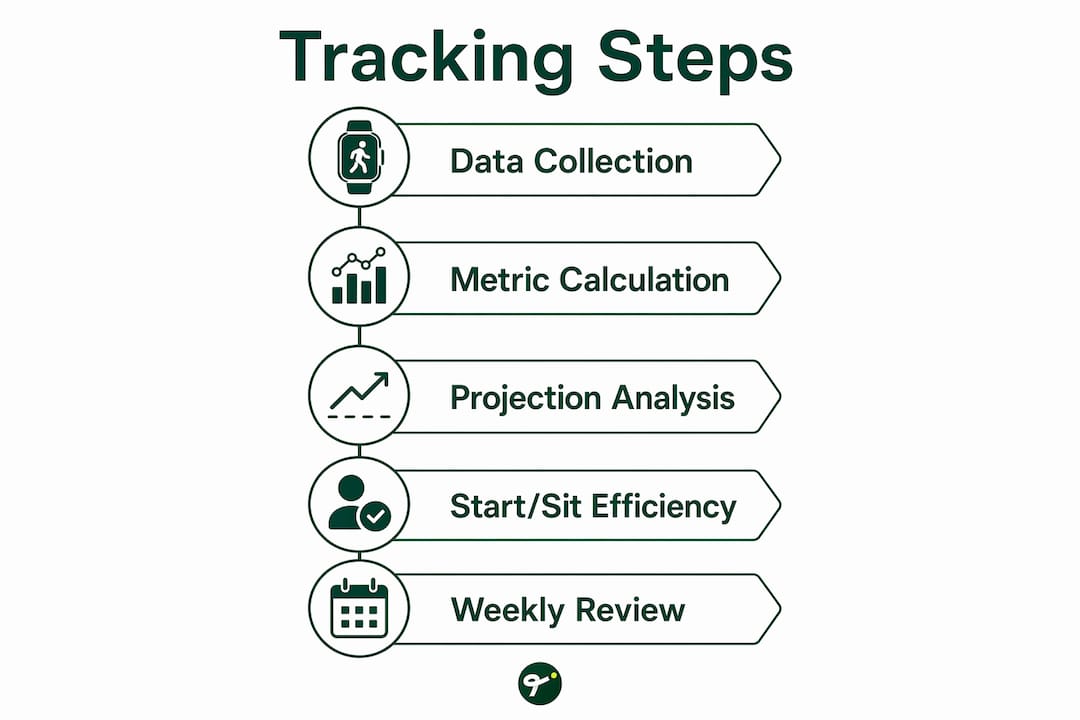
A reliable tracking system follows five repeatable steps. Skipping any one of them creates gaps that distort your analysis by the end of the season.
-
Collect raw data weekly. Pull your weekly scores, starting lineups, and transaction logs every Monday. Do not wait until the end of the season. Missing weeks means missing context for trends.
-
Calculate your core metrics. Add PF, PA, and DIFF to a running log. Calculate start/sit efficiency by comparing your actual starting lineup score to the highest-scoring lineup you could have fielded from your roster. This number compounds over a season into a clear picture of decision quality.
-
Evaluate projection accuracy. Track your MAE each week. If your MAE climbs above 5.0 points consistently, your projection source is underperforming. A correlation coefficient above 0.65 confirms your projections are capturing real signal rather than random variance.
-
Analyze trends, not snapshots. One bad week means nothing. Eight weeks of data starts to reveal patterns. Stabilization thresholds vary by metric, but most fantasy stats need at least 6–8 weeks before they reflect true performance rather than noise.
-
Adjust strategy based on findings. If your start/sit efficiency is low, you are leaving points on the bench through poor lineup decisions. If your DIFF is positive but your record is negative, your schedule has been unlucky and your roster is stronger than it looks. Use live data integration to refine these adjustments in real time.
For players in cash contests, add a sixth step: maintain a record of all deposits, winnings, and net profits throughout the year. Fantasy winnings require reporting as ordinary income, and prize money from private leagues must be self-reported regardless of whether a 1099-MISC is issued.
| Step | Method | Output |
|---|---|---|
| Data collection | Weekly score and lineup export | Raw dataset |
| Metric calculation | Spreadsheet formulas | PF, PA, DIFF, efficiency |
| Projection review | MAE and correlation tracking | Projection quality score |
| Trend analysis | 6–8 week rolling averages | Reliable performance signal |
| Strategy adjustment | Lineup and roster changes | Improved decision-making |
What mistakes should you avoid when analyzing your results?
The most common error is treating win-loss record as the primary measure of skill. Relying solely on standings misses the luck embedded in head-to-head scheduling. Two players can have identical rosters and end up with very different records simply based on who they faced each week.
Small sample size is the second major trap. Reacting to three weeks of data as if it represents a trend leads to bad roster decisions. Respecting stabilization thresholds prevents overreaction to early-season volatility. A receiver's target share, for example, does not stabilize until roughly 8 games in the NFL.
Common mistakes to avoid:
- Ignoring DIFF: A positive point differential with a losing record signals schedule luck, not a weak team.
- Overreacting to weekly noise: One bad week from a player is not a trend. Eight weeks is.
- Skipping MAE tracking: Without measuring projection error, you cannot tell whether your lineup decisions are based on good information or bad forecasts.
- Manual entry errors: Cross-check any hand-entered data against your platform's official scores at least once per month.
- Missing tax records: Failing to log cash contest winnings throughout the year creates a scramble at tax time.
"Both MAE and RMSE should be evaluated to understand projection quality, as RMSE highlights large, damaging errors that MAE averages out." — Fantasy Projection Lab
Pro Tip: Automate your data exports wherever possible. Manual entry introduces errors that compound over a season. Even a simple script that pulls weekly scores into a spreadsheet removes a major source of inaccuracy from your tracking system.
Key Takeaways
Tracking fantasy league performance requires combining core metrics, the right tools, and a consistent weekly process to separate skill from luck.
| Point | Details |
|---|---|
| Points For drives skill assessment | PF is the most reliable indicator of roster quality and lineup decisions across a season. |
| Point Differential beats win-loss | DIFF removes scheduling luck and gives a cleaner measure of true team strength. |
| Projection accuracy needs benchmarks | An MAE below 5.0 and a correlation above 0.65 confirm your projections are worth trusting. |
| Stabilization thresholds prevent overreaction | Most fantasy metrics need 6–8 weeks of data before they reflect real performance trends. |
| Cash players must track earnings | All fantasy winnings are taxable income; maintain records throughout the year, not just at tax time. |
Why I think most fantasy players are tracking the wrong thing
Most players I talk to obsess over their record. They check the standings every Tuesday morning and feel good or bad based entirely on whether they won or lost that week. That instinct is understandable. It is also the slowest path to actually getting better.
The players who improve year over year are the ones tracking leaderboard systems alongside their own metrics. They know their PF rank. They know their start/sit efficiency. They know whether their projection source is performing above or below a 5.0 MAE threshold. That level of self-awareness separates a player who gets lucky once from one who competes at the top of their league consistently.
The tax piece catches people off guard too. I have seen players win real money in cash contests all season and then scramble in april because they kept no records. Tracking your earnings is not just about compliance. It tells you whether you are actually profitable over time, which is the most honest measure of performance there is.
The best tracking systems are simple enough to maintain every week without burning out. A spreadsheet with five columns beats a complex analytics setup you abandon by week 6. Start with PF, PA, DIFF, and start/sit efficiency. Add projection accuracy once those feel automatic. Build the habit before you build the system.
— Nathan
Tweener gives you a built-in edge in fantasy tennis
Fantasy tennis is one of the few sports where surface, head-to-head records, and tournament draw all feed directly into performance outcomes. Tweener is built around that reality.

Tweener lets you build teams from real ATP and WTA players and compete in leagues tied to live tournament results. The platform tracks how your picks perform across every match, giving you the kind of granular feedback that makes tracking player performance genuinely useful rather than decorative. Private leagues let you compete with up to 9 friends across Grand Slams, and the cash mode adds real stakes for players who want to test their analytical edge. If you are serious about fantasy sports and want a format where skill compounds over time, Tweener is where tennis fans compete at the highest level.
FAQ
What does Points For mean in fantasy leagues?
Points For (PF) is the total number of points your team has scored across all weeks of the season. It is the most reliable indicator of roster strength and lineup decision quality.
How do I calculate point differential in fantasy sports?
Point Differential is your total Points For minus your total Points Against across the season. A positive DIFF with a losing record typically signals bad scheduling luck rather than a weak team.
What is a good MAE for fantasy projections?
An MAE below 5.0 points at skill positions indicates competitive projection accuracy. A correlation coefficient above 0.65 confirms the projections are capturing meaningful signal rather than random noise.
Do I need to report fantasy winnings on my taxes in 2026?
All fantasy winnings are taxable as ordinary income regardless of amount. The 1099-MISC issuance threshold increased to $2,000 for tax year 2026, but prize money from private leagues must still be self-reported even without a form.
How many weeks of data do I need before my metrics are reliable?
Most fantasy performance metrics need at least 6–8 weeks of data to stabilize and reflect true performance trends. Reacting to fewer weeks risks overreacting to noise rather than identifying real patterns.